4 releases
| 0.1.3 | Mar 26, 2021 |
|---|---|
| 0.1.2 | Mar 26, 2021 |
| 0.1.1 | Mar 26, 2021 |
| 0.1.0 | Mar 26, 2021 |
#514 in Visualization
4MB
241 lines
Contains (Zip file, 4MB) web/dist/bundle.zip
Visualizer CLI
A tool to visualize data. See this playground for which data can be visualized.
Based on @hediet/visualization which also powers the Debug Visualizer extension for VS Code.
Best for debugging algorithms. Not suited to visualize large datasets. Requires WebView 2 on Windows.
Installation
cargo install visualizer-cli
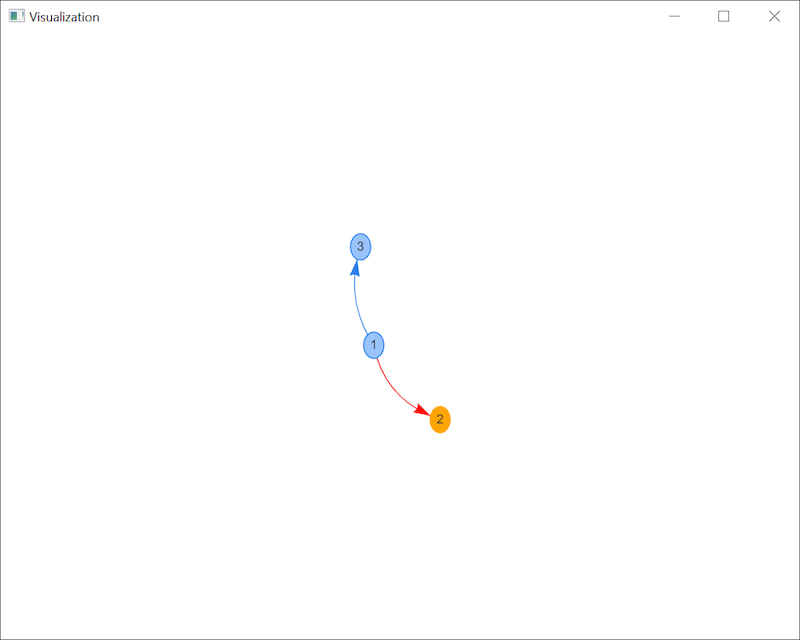
Example: Visualize A Directed Graph
cat data.json | visualize
With data.json:
{
    "$schema": "https://hediet.github.io/visualization/docs/visualization-data-schema.json",
    "kind": { "graph": true },
    "nodes": [
        { "id": "1", "label": "1" },
        { "id": "2", "label": "2", "color": "orange" },
        { "id": "3", "label": "3" }
    ],
    "edges": [
        { "from": "1", "to": "2", "color": "red" },
        { "from": "1", "to": "3" }
    ]
}

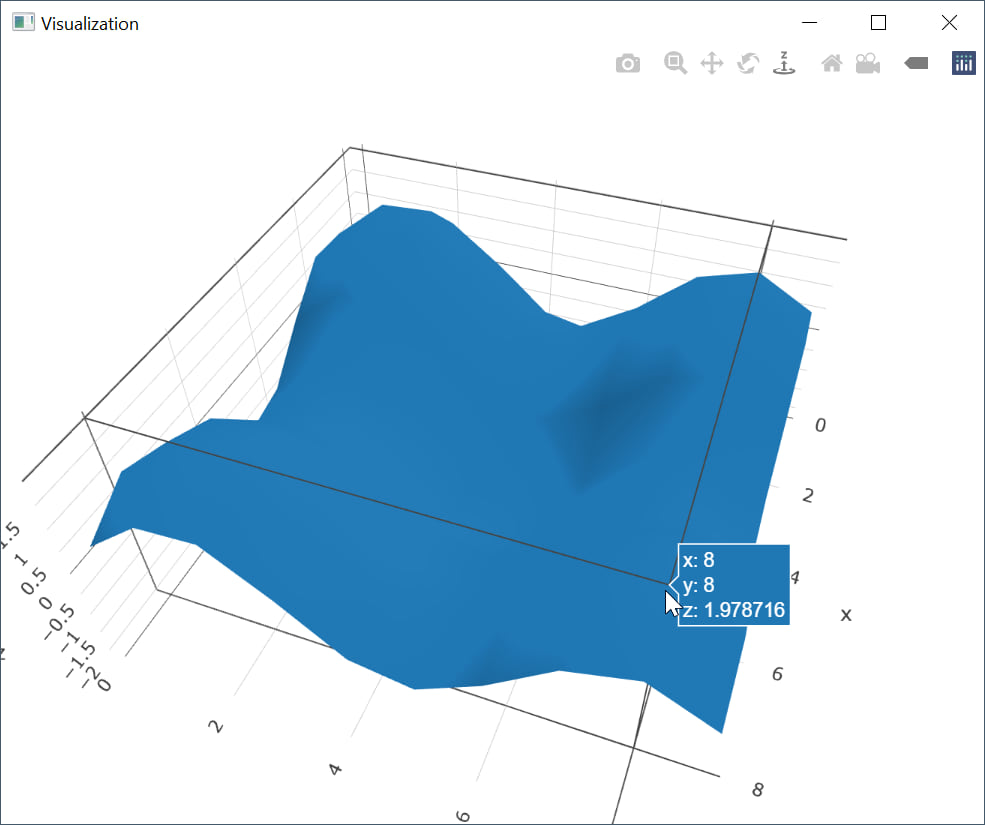
Example: Visualize A 3D Plot
cat data.json | visualize
With data.json:
{
    "$schema": "https://hediet.github.io/visualization/docs/visualization-data-schema.json",
    "kind": {
        "plotly": true
    },
    "data": [
        {
            "type": "mesh3d",
            "x": [ 0, 0, 0, ... ],
            "y": [ 0, 1, 2, ... ],
            "z": [ 0, 0.84, 0.9, ... ]
        }
    ]
}

API / Rust Usage
See the visualizer crate.
Architecture
This CLI uses Tauri/WRY to host a webview which loads @hediet/visualization.
Dependencies
~24–39MB
~623K SLoC