1 unstable release
| 0.1.0 | Jun 8, 2022 |
|---|
#1012 in Debugging
12KB
159 lines
tracing-libatrace
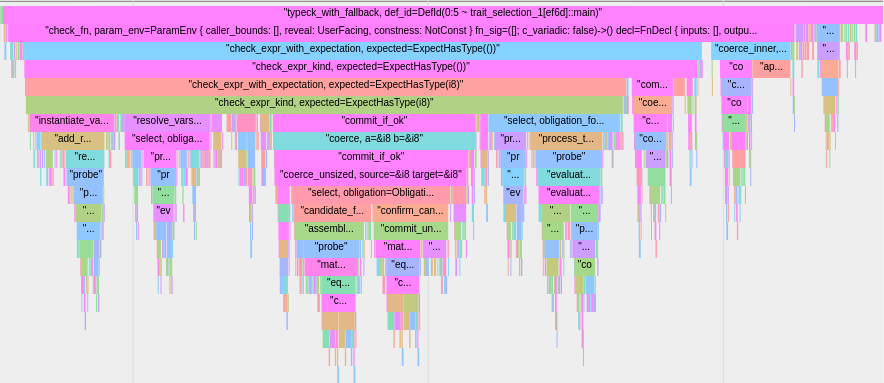
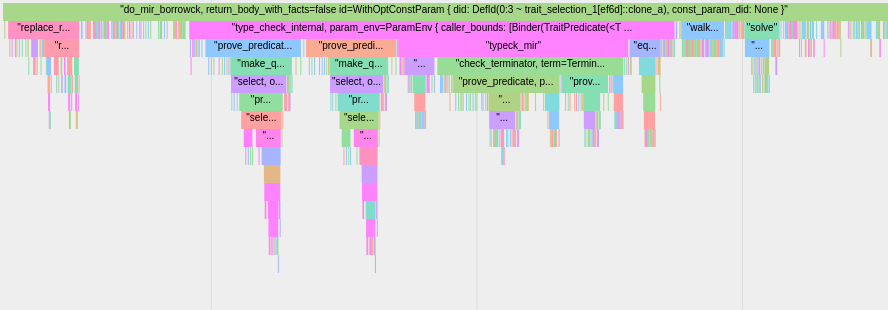
Instrument your application with tracing and libatrace, and get stack view of your application activity with timing information using chrome browser:


Setup
After instrumenting your app with tracing, add this subscriber like this:
let subscriber = tracing_subscriber::Registry::default().with(tracing_libatrace::layer());
tracing::subscriber::set_global_default(subscriber).unwrap();
Other
when running your application, you must run tracing atrace standalone to capture tracing log output,
and then open chrome browser with url chrome://tracing/ to load tracing log and view your application activity with timing and callstack.
Dependencies
~1.5MB
~28K SLoC