2 unstable releases
| new 0.7.0 | Apr 20, 2025 |
|---|---|
| 0.6.4 | Mar 17, 2025 |
| 0.6.3 |
|
| 0.5.0 |
|
| 0.2.3 |
|
#331 in Command line utilities
124 downloads per month
265KB
7K
SLoC
qmassa!

General description
qmassa is a Rust terminal-based tool for displaying GPUs usage stats on Linux. It aims to display as much device and DRM clients (processes using the GPU) information as possible. Command-line options and which user is running the tool control how much can be displayed.
Most of the information is gathered through a GPU vendor and driver agnostic interface such as standard files in /proc and /sys or by using udev. For some of the stats, though, a driver-specific way is needed, and qmassa then leverages what the kernel drivers expose in their uAPI (e.g. specific query ioctls), specific sysfs files/directories or through perf events.
Requirements
The minimum requirements to compile & run qmassa are:
- Compile-time: Rust v1.74 or later, pkg-config and libudev development packages
- Runtime: Linux kernel v6.8 or later to report most usage stats
How to install it
The recommendation is to install qmassa using cargo. If you want to install the latest release on crates.io using qmassa's lock file:
cargo install --locked qmassa
If you want to install the latest development version using qmassa's lock file:
cargo install --locked --git https://github.com/ulissesf/qmassa
How to use it
Important
If you want to run qmassa as a non-root user, it needs to be added to at least the video, render, and power groups (or equivalent ones in your Linux distribution). That is needed so qmassa can open the DRM device nodes to collect information from ioctls. If your user is not in the right groups you'll likely get "Permission denied" errors.
Running it as non-root user without any command-line options will display limited device usage information and the DRM clients stats from processes that user has access to in /proc.
qmassa
Running it as the root user without any command-line options will display all the device avaiable stats along with all active DRM clients in the system.
sudo qmassa
Only show a specific GPU device and DRM clients using it. The GPU device is specified by its PCI device slot name.
sudo qmassa -d 0000:03:00.0
Only show DRM clients from the process tree starting at a specific PID.
sudo qmassa -p 2876
Running for only 5 iterations (stats updates).
sudo qmassa -n 5
Changing the interval between stats updates to 1s (1000 ms). The UI will be updated on the same frequency or whenever user interaction happens.
sudo qmassa -m 1000
Showing all DRM clients including the inactive ones (no memory allocated or engines being used).
sudo qmassa -a
Run qmassa's TUI and save stats to a JSON file.
sudo qmassa -t data.json
Run qmassa without the TUI and save stats to a JSON file.
sudo qmassa -x -t data.json
Run qmassa's TUI to replay data from a JSON file.
sudo qmassa replay -j data.json
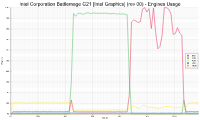
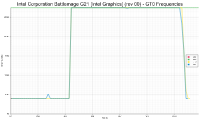
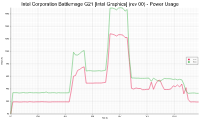
Plot SVG charts (with "chart" prefix) for all GPUs data in a JSON file. Some examples of generated charts can be seen below.
sudo qmassa plot -j data.json -o chart


Fields description
Per device (on main screen)
| Field | Description |
|---|---|
| DRIVER | Kernel driver being used |
| TYPE | Integrated, Discrete or Unknown |
| DEVICE NODES | Character device nodes in /dev/dri |
| SMEM | System memory used / Total system memory |
| VRAM | Device memory used / Total device memory |
| [Engines] | Overall engine usage in the last iteration |
| FRQ-* | Actual frequency / Maximum frequency limit |
| POWER | GPU power usage / Package power usage |
| TP-* | Temperature |
| FAN-* | Fan speed |
The memory usage values are either in bytes (no letter), or in KiB (using "K" letter), or in MiB (using "M" letter), or in GiB (using "G" letter). The values are rounded to be easily displayed in a small space, but if you save the stats to a JSON file you can get them all in bytes. VRAM data is only displayed for discrete GPUs.
The overall engines usage depends on the DRM clients that the user has access to. In order to have a system view, please run qmassa as root.
The frequency graphs range from min to max values and plot the instant driver-requested (if supported) and actual device/engines frequency for each iteration. The graph legend shows the latest value for those frequencies. The graph also indicates the overall status and PL1 throttle reason (for now only valid on i915 and Xe drivers). All the frequency values are in MHz.
The intention of the power reporting is to have values that are the closest possible to the power usage from both the GPU and the larger package (or card) containing it. It's good to remember that larger package is different on integrated vs discrete GPUs, and there are limitations on what drivers expose and what they have visibility on so expect the information to vary a lot across GPUs and vendors. All the power usage values are in watts (W).
Temperatures and fan speeds are displayed only for discrete GPUs exposing them through the hwmon kernel infrastructure (Intel and AMD, for now). The temperature values are all in Celsius (C), and the fan speeds are all in revolutions per minute (RPM).
Driver support
The table below shows the current drivers and features supported in qmassa to get device information.
| Driver | Dev Type | Mem Info | Engines | Freqs | Power | Client Mem Info | Temperatures | Fans |
|---|---|---|---|---|---|---|---|---|
| xe | ✅ | ✅ | ✅ | ✅ | ✅ | ✅ | ✅ (only dGPUs, Linux kernel 6.15+) | ✅ (only dGPUs, Linux kernel 6.16+) |
| i915 | ✅ | ✅ | ✅ | ✅ | ✅ | ✅ | ✅ (only dGPUs) | ✅ (only dGPUs) |
| amdgpu | ✅ | ✅ | ✅ | ✅ | ✅ (only dGPUs) | ✅ (Linux kernel 6.13+) | ✅ (only dGPUs) | ✅ (only dGPUs) |
| * | ✅ (via DRM fdinfo) | ✅ (only "memory" region in DRM fdinfo) |
qmassa is tested on some Intel and AMD GPUs but it relies heavily on kernel drivers exposing consistent support across GPUs. If you have a problem, please file an issue so we can debug it.
Limitations
- i915: the kernel driver doesn't track/report system memory used.
- amdgpu: processes using kfd don't report engines and memory usage through any open file descriptor of a DRM device node.
Per DRM client (on main screen)
DRM clients have unique IDs per device which are assigned for every open file descriptor of one of the device nodes in the /dev/dri folder. The same process ID (PID) can have multiple DRM clients and those file descriptors can also be shared across different processes. qmassa shows only one PID for every DRM client ID, but it can display multiple entries in the list with the same PID.
The engines and memory usage stats per DRM client are gathered following the specs defined on DRM client usage stats.
| Field | Description |
|---|---|
| PID | Process ID |
| SMEM | Resident amount of system memory |
| VRAM | Resident amount of device memory |
| MIN | Minor number of /dev/dri device node being used |
| ID | DRM client ID |
| [Engines] | Engine usage in the last iteration |
| CPU | CPU usage in the last iteration |
| COMMAND | /proc/PID/comm /proc/PID/cmdline |
The memory usage for DRM clients follow the same format and units as described in the previous per device section. All the values can also be found in bytes when stats are saved to a JSON file. VRAM data is only displayed for DRM clients on discrete GPUs.
The engines reported are driver and vendor specific, and are read directly from the DRM fdinfo files in /proc.
The CPU usage is measured by how much CPU time that process used versus the available time for that iteration. The percentage value is relative to a single CPU, so in the case of processes with multiple threads the calculated value can be higher than 100%.
DRM client screen
The DRM client list can be scrolled up, down, left and right to select a row or to show long command lines. Selecting a row in the list (pressing Enter) opens a screen with just that DRM client stats and charts. In this screen, the memory stats in the table provide some more information (see description below), while the other data is the same as on the main screen.
| Field | Description |
|---|---|
| SMEM | System memory resident / System memory used |
| VRAM | Device memory resident / Device memory used |
The VRAM data is only displayed for DRM clients on discrete GPUs.
Acknowledgements
qmassa uses Ratatui for displaying a nice terminal-based UI and leverages many other Rust crates.
License
Copyright © 2024-2025 Ulisses Furquim
This project is distributed under the terms of the Apache License (Version 2.0). See LICENSE for details.
Dependencies
~13–26MB
~401K SLoC
