1 unstable release
| 0.3.0 | Feb 14, 2021 |
|---|
#10 in #gnuplot
135KB
214 lines
procrec
A simple recorder for cpu and memory usage of processes.
Currently, linux as well as macos are supported. Results are outputted in machine parsable format to stdout or can be directly plotted using gnuplot (must be in $PATH).
Installation
Unfortunately, clap 3.0 is not yet published to crates.io. Thus, the following does not work (yet):
cargo install procrec
Therefore, manual installation from github is required:
$ git clone https://github.com/gh0st42/procrec
$ cargo install --path .
If you want plotting functionality you also need to install gnuplot via your package manager (e.g., sudo apt install gnuplot or brew install gnuplot).
Usage
Help
$ procrec -h
procrec 0.2.2
Lars Baumgaertner
Process recorder to log cpu utilization and memory consumption

USAGE:
    procrec [FLAGS] [OPTIONS] --pid <pid>

FLAGS:
    -g, --graph            Display graph using gnuplot
    -h, --help             Prints help information
    -t, --print-gnuplot    Just print gnuplot script
    -v, --verbose          A level of verbosity, and can be used multiple times
    -V, --version          Prints version information

OPTIONS:
    -d, --duration <duration>    Duration for observation
    -i, --interval <interval>    Sampling interval in seconds [default: 2]
    -p, --pid <pid>              Process to be inspected
Examples
Interactive recording of specific process:
$ pgrep iTerm
4730
4742
4748
4769
4772

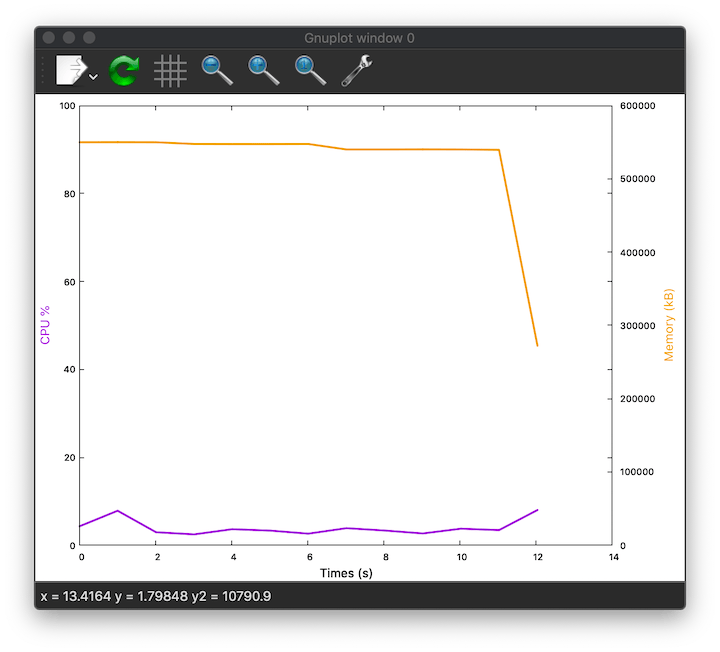
$ procrec -p 4730 -g -i 1 -v
0.00 PID 1119 CPU% 4.32 RSS 549793 VSIZE 10123419
1.00 PID 1119 CPU% 7.84 RSS 549863 VSIZE 10123137
2.01 PID 1119 CPU% 2.96 RSS 549830 VSIZE 10119688
3.01 PID 1119 CPU% 2.47 RSS 547377 VSIZE 10087645
4.01 PID 1119 CPU% 3.65 RSS 547340 VSIZE 10091315
5.01 PID 1119 CPU% 3.31 RSS 547340 VSIZE 10091315
6.01 PID 1119 CPU% 2.63 RSS 547377 VSIZE 10087645
7.01 PID 1119 CPU% 3.87 RSS 539983 VSIZE 10074480
8.01 PID 1119 CPU% 3.34 RSS 539992 VSIZE 10074480
9.02 PID 1119 CPU% 2.68 RSS 540028 VSIZE 10070810
10.02 PID 1119 CPU% 3.75 RSS 539992 VSIZE 10074480
11.02 PID 1119 CPU% 3.43 RSS 539451 VSIZE 10073919
^C12.03 PID 1119 CPU% 8.01 RSS 272269 VSIZE 9775452
Afterwards a gnuplot window pops up and visualizes the data:

Alternatives
pidstatfrom the sysstat package for pure recording, no plotting - written in C and probably available in most distro package managers- psrecord a nice python tool for recording and plotting (using
matplotlib) - installation viapip
Dependencies
~5–14MB
~207K SLoC