49 releases
| 0.5.23 | Jan 21, 2022 |
|---|---|
| 0.5.22 | Nov 12, 2021 |
| 0.5.20 | Oct 10, 2021 |
| 0.5.17 | Jul 24, 2021 |
| 0.1.1 | Nov 12, 2019 |
#5 in #traceback
102 downloads per month
Used in mirror_sparse_matrix
140KB
2.5K
SLoC
See pretty_trace for documentation.
lib.rs:
This crate provide tools for generating pretty tracebacks and for profiling.
Pretty tracebacks
Stack traces (or "tracebacks") are a fundamental vehicle for describing what code is doing at a given instant. A beautiful thing about rust is that crashes nearly always yield tracebacks, and those tracebacks nearly always extend all the way from the 'broken' code line all the way to the main program. We may take these properties for granted but in general neither is true for other languages, including C++.
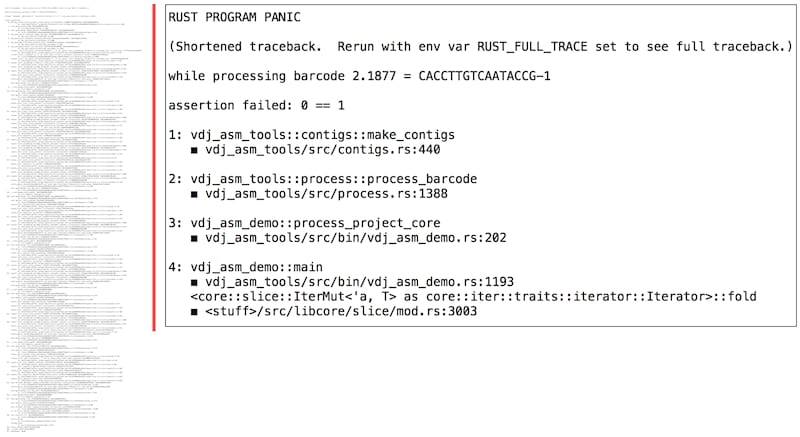
However, as in other languages, native rust tracebacks are verbose. A major goal of this crate is to provide succinct and readable "pretty" tracebacks, in place of the native tracebacks. These pretty traces can be ten times shorter than native tracebacks. In addition, unlike rust native tracebacks, pretty traces are obtained without setting an environment variable.
Example of native versus pretty trace output

Profiling
Profiling is a fundamental tool for optimizing code. Standard profiling tools including perf are powerful, however they can be challenging to use. This crate provides a profiling capability that is completely trivial to invoke and interpret, and yields a tiny file as output.
The idea is very simple: if it is possible to significantly speed up your code,
this should be directly visible from a modest sample of tracebacks chosen at
random. And these tracebacks can be generated for any main program by adding a
simple command-line option to it that causes it to enter a special 'profile'
mode, gathering tracebacks and then terminating. This uses the pprof
crate to gather tracebacks.
For example this command-line option might be
PROFILE to turn on profiling. It's your choice how to specify
this command-line option, but this crate makes it trivial to do so.
With a few minutes' work,
you can make it possible to profile your code with essentially zero work,
whenever you like. See the functions start_profiling and
stop_profiling. Note that to produce useful output, one needs to specify a list
of blacklisted crates, such as std. The entries from these crates are removed
from the tracebacks.
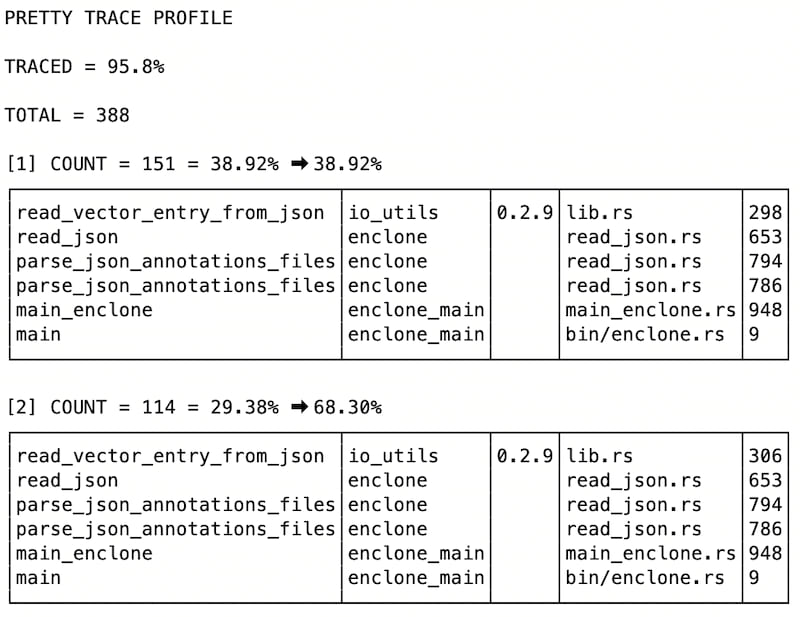
Example of pretty trace profiling output

Here pretty trace profiling reveals exactly what some code was doing at random instances; we show the first of the collated tracebacks. More were attempted: of attempted tracebacks, 95.8% are reported. Unreported tracebacks would be those lying entirely in blacklisted crates.
Each line shows a function name, the crate it is in, the version of the crate (if known), the file name in the crate, and the line number.
A brief guide for using pretty trace
First make sure that you have rust debug on: it seems to be enough to have
debug = 1 set in Cargo.toml for debug and/or release mode,
depending on which youre using.
Now to access pretty trace, put this in your Cargo.toml
pretty_trace = {git = "https://github.com/10XGenomics/rust-toolbox.git"}
and this
use pretty_trace::*;
in your main program.
Next to turn on pretty traces, it is enough to insert this
PrettyTrace::new().on();
at the beginning of your main program. And you're good to go! Any panic will cause a pretty traceback to be generated.
Several other useful features are described below. These include the capability of tracing to know where you are in your data (and not just your code), and for focusing profiling on a key set of crates that you're optimizing.
Credit
This code was developed at 10x Genomics, and is based in part on C++ code developed at the Whitehead Institute Center for Genome Research / Broad Institute starting in 2000, and included in https://github.com/CompRD/BroadCRD.
FAQ
1. Could a pretty traceback lose important information?
Possibly. For this reason we provide the capability of dumping a full
traceback to a file (as 'insurance') and also an environment variable to
force full tracebacks. However we have not seen examples where important
information is lost.
2. Can the pretty traceback itself be saved to a separate file?
Yes this capability is provided.
3. Can I get a traceback on Ctrl-C?
Yes, if you do this
PrettyTrace::new().ctrlc().on();
then any Ctrl-C will be converted into a panic, and then you'll get a trackback.
Full disclosure
◼ The code has only been confirmed to work under linux. The code has been used under OS X, but tracebacks can be incomplete. An example is provided of this behavior.
◼ Ideally out-of-memory events would be caught and converted to panics so we could trace them, but we don't. This is a general rust problem that no one has figured out how to solve. See issue 43596 and internals 3673.
◼ The code parses the output of a formatted stack trace, rather then generating output directly from a formal stack trace structure (which it should do). This makes it vulnerable to changes in stack trace formatting.
◼ There is an ugly blacklist of strings that is fragile. This may be an intrinsic feature of the approach.
◼ In general, tracebacks in parallel code do not go back to the main program.
More
See the documentation for PrettyTrace, linked to below.
To do
◼ Rewrite so that tracebacks are formatted in the same way in all cases, in the fashion carried out by profiling. And reuse the same code.
Dependencies
~10–22MB
~354K SLoC