4 stable releases
| 1.2.0 | Sep 21, 2022 |
|---|---|
| 1.1.0 | Sep 21, 2022 |
| 1.0.1 | Sep 19, 2022 |
| 1.0.0 | Sep 18, 2022 |
#11 in #measure-time
137 downloads per month
36KB
410 lines
Measuring CPU core-to-core latency
![]()
![]()
![]()
We measure the latency it takes for a CPU to send a message to another CPU via its cache coherence protocol.
By pinning two threads on two different CPU cores, we can get them to do a bunch of compare-exchange operation, and measure the latency.
How to run:
$ cargo install core-to-core-latency
$ core-to-core-latency
Single socket results
| CPU | Median Latency |
|---|---|
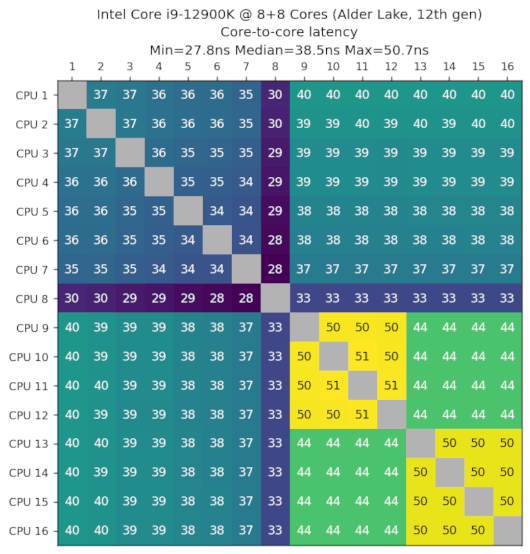
| Intel Core i9-12900K, 8P+8E Cores, Alder Lake, 12th gen, 2021-Q4 | 35ns, 44ns, 50ns |
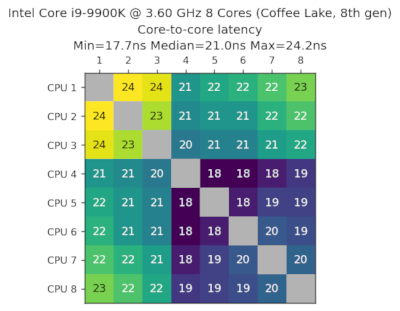
| Intel Core i9-9900K, 3.60GHz, 8 Cores, Coffee Lake, 9th gen, 2018-Q4 | 21ns |
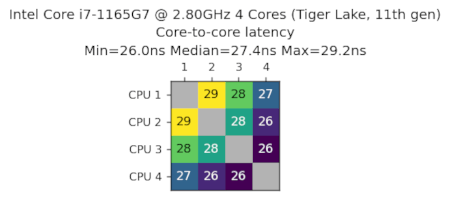
| Intel Core i7-1165G7, 2.80GHz, 4 Cores, Tiger Lake, 11th gen, 2020-Q3 | 27ns |
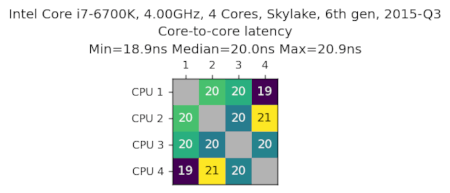
| Intel Core i7-6700K, 4.00GHz, 4 Cores, Skylake, 6th gen, 2015-Q3 | 27ns |
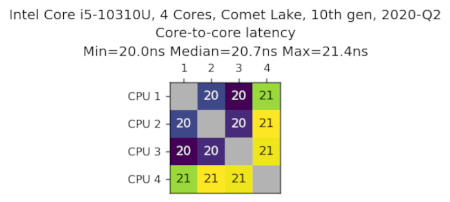
| Intel Core i5-10310U, 4 Cores, Comet Lake, 10th gen, 2020-Q2 | 21ns |
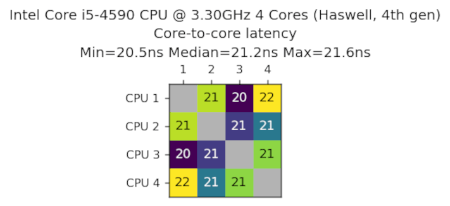
| Intel Core i5-4590, 3.30GHz 4 Cores, Haswell, 4th gen, 2014-Q2 | 21ns |
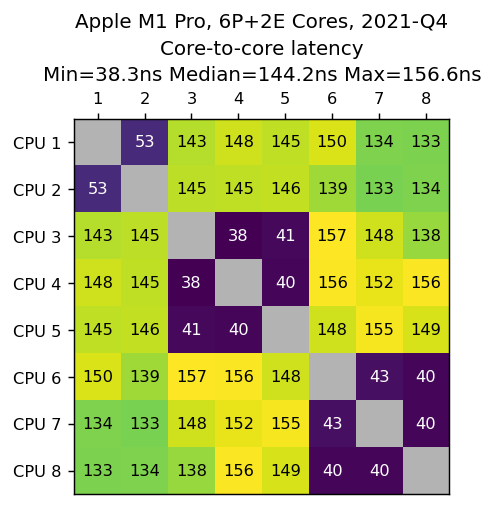
| Apple M1 Pro, 6P+2E Cores, 2021-Q4 | 40ns, 53ns, 145ns |
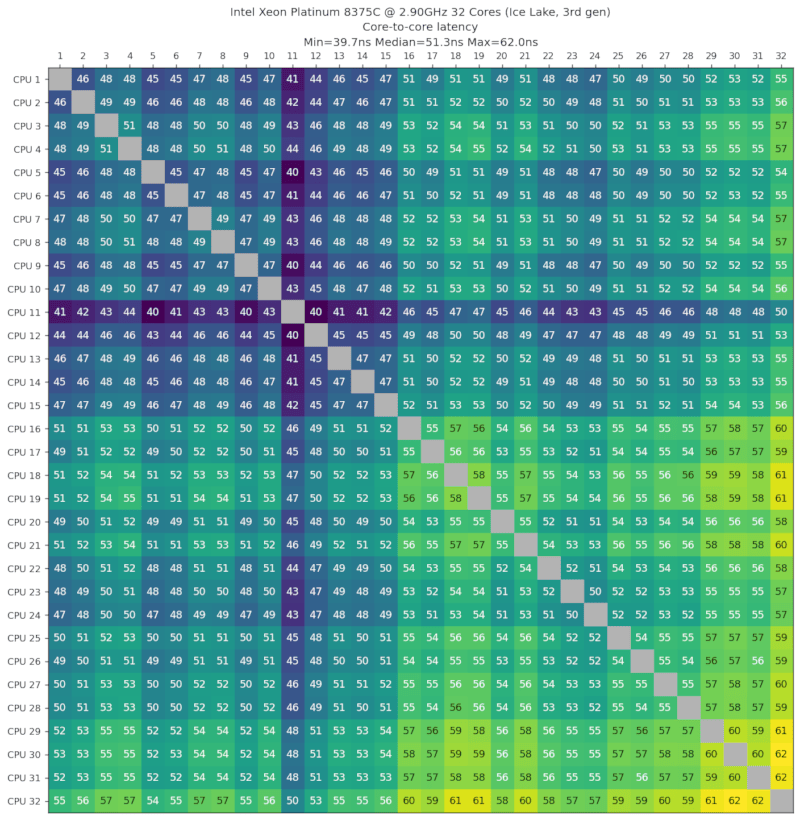
| Intel Xeon Platinum 8375C, 2.90GHz, 32 Cores, Ice Lake, 3rd gen, 2021-Q2 | 51ns |
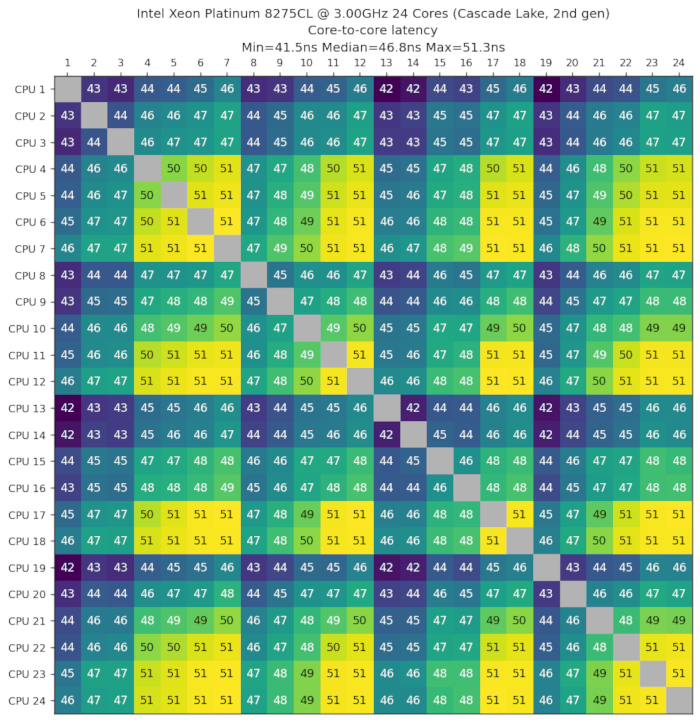
| Intel Xeon Platinum 8275CL, 3.00GHz, 24 Cores, Cascade Lake, 2nd gen, 2019-Q2 | 47ns |
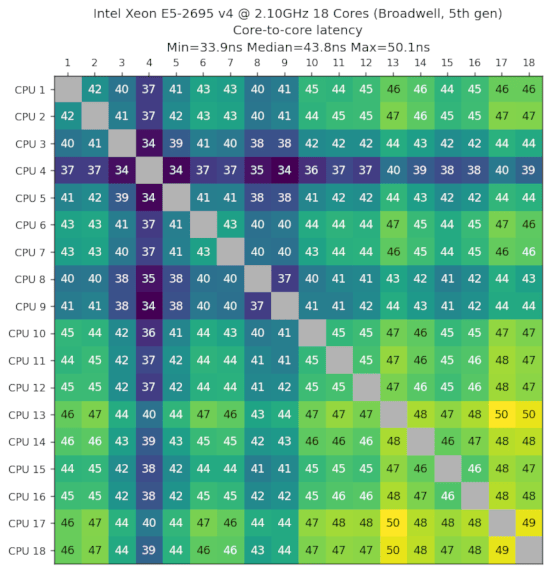
| Intel Xeon E5-2695 v4, 2.10GHz, 18 Cores, Broadwell, 5th gen, 2016-Q1 | 44ns |
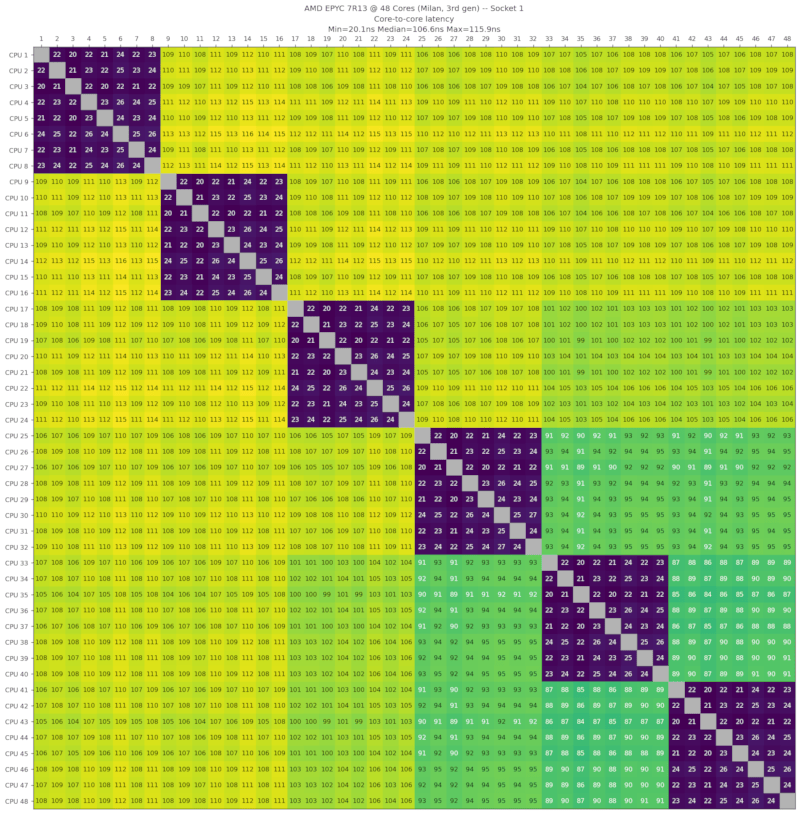
| AMD EPYC 7R13, 48 Cores, Milan, 3rd gen, 2021-Q1 | 23ns, 107ns |
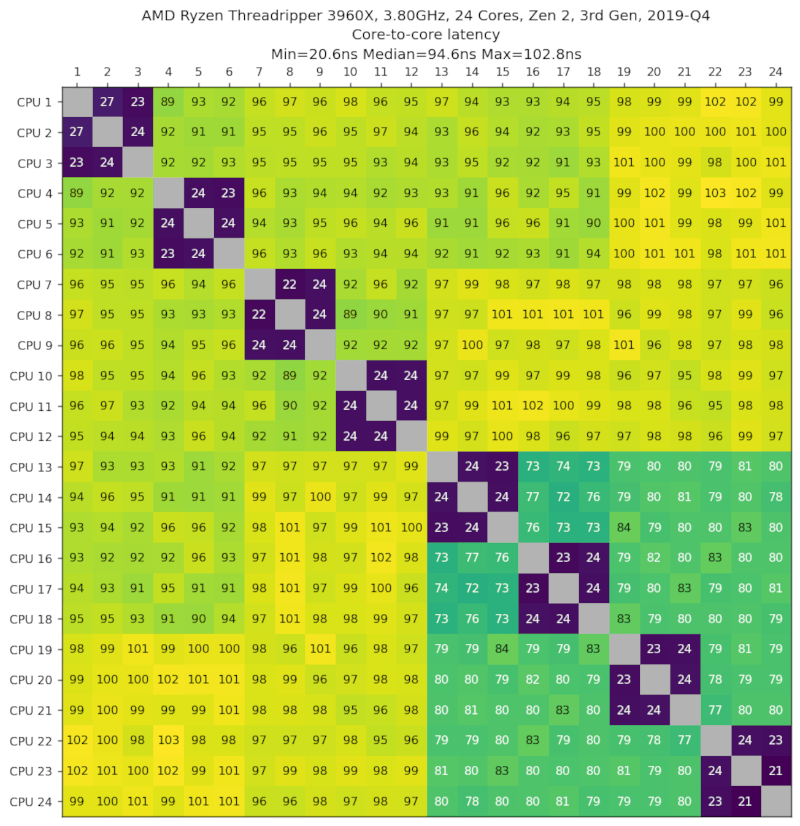
| AMD Ryzen Threadripper 3960X, 3.80GHz, 24 Cores, Zen 2, 3rd Gen, 2019-Q4 | 24ns, 94ns |
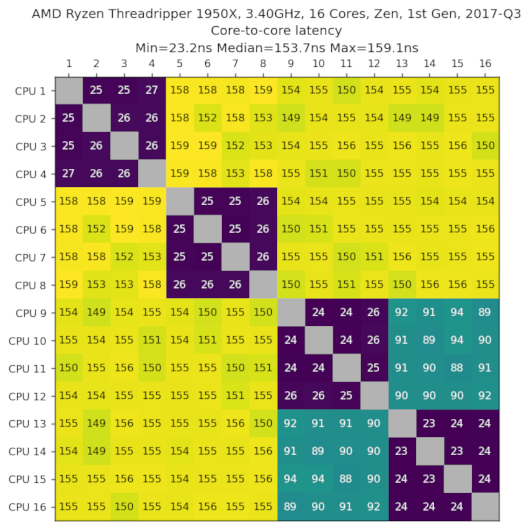
| AMD Ryzen Threadripper 1950X, 3.40GHz, 16 Cores, Zen, 1st Gen, 2017-Q3 | 25ns, 154ns |
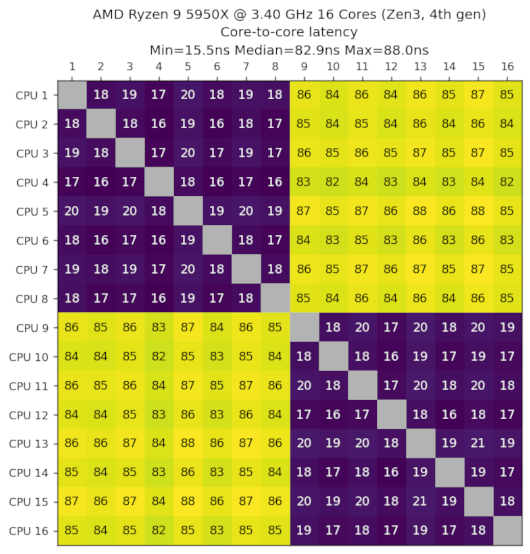
| AMD Ryzen 9 5950X, 3.40GHz, 16 Cores, Zen3, 4th gen, 2020-Q4 | 17ns, 85ns |
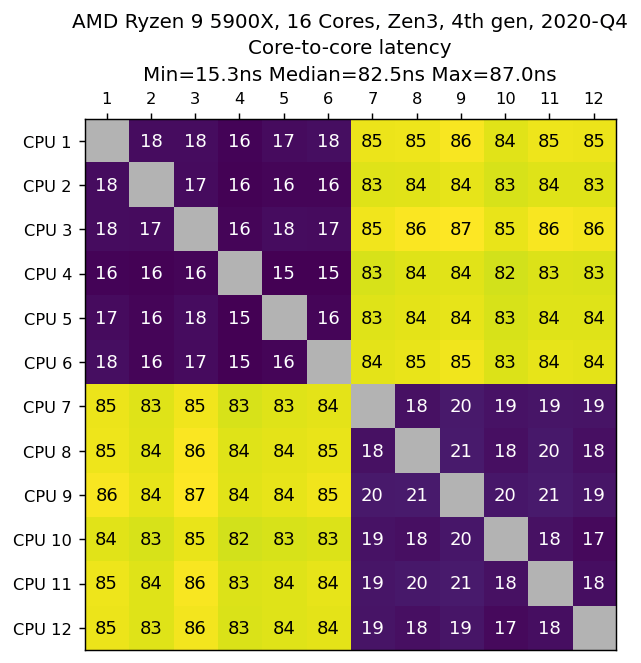
| AMD Ryzen 9 5900X, 3.40GHz, 12 Cores, Zen3, 4th gen, 2020-Q4 | 16ns, 84ns |
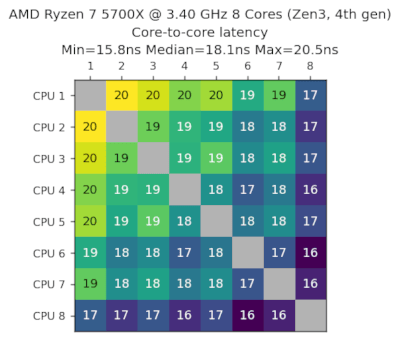
| AMD Ryzen 7 5700X, 3.40GHz, 8 Cores, Zen3, 4th gen, 2022-Q2 | 18ns |
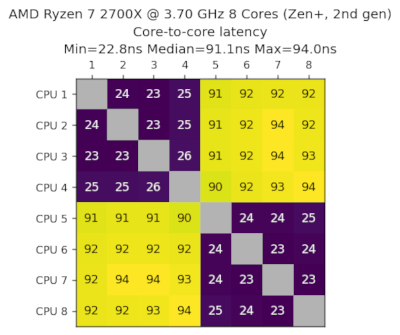
| AMD Ryzen 7 2700X, 3.70GHz, 8 Cores, Zen+, 2nd gen, 2018-Q3 | 24ns, 92ns |
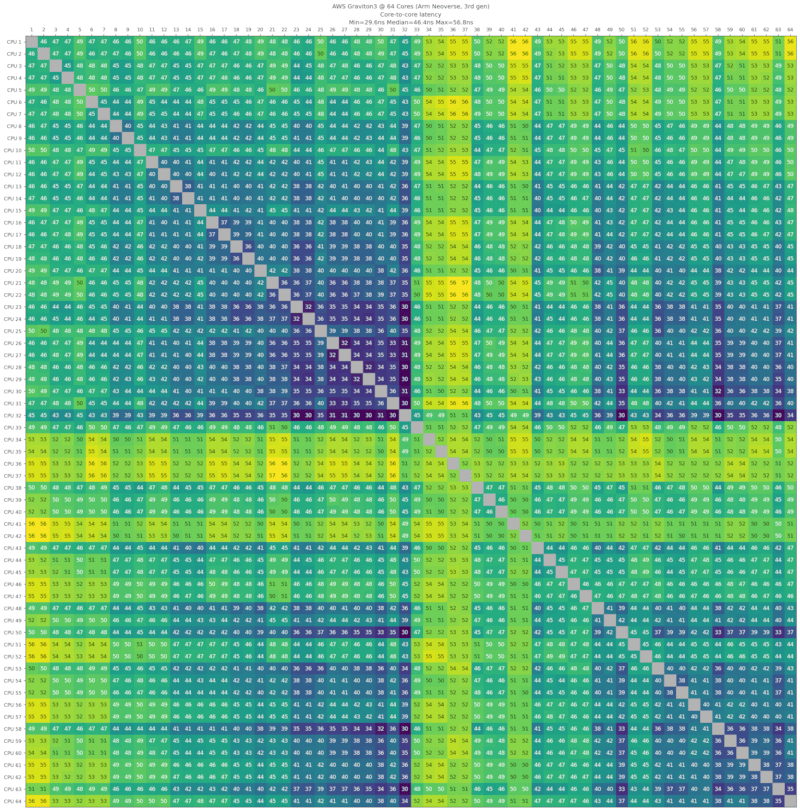
| AWS Graviton3, 64 Cores, Arm Neoverse, 3rd gen, 2021-Q4 | 46ns |
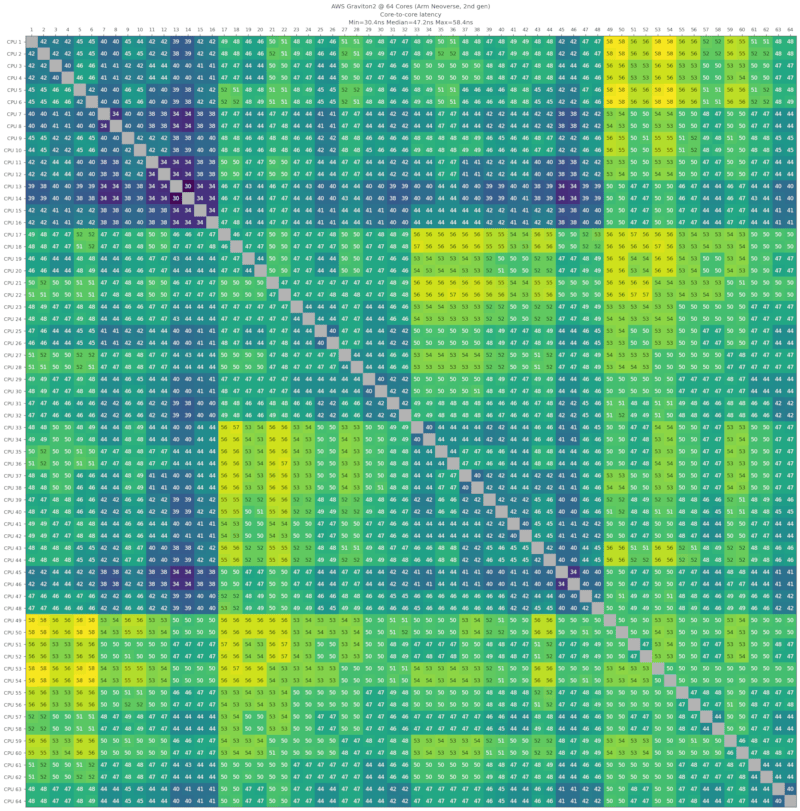
| AWS Graviton2, 64 Cores, Arm Neoverse, 2rd gen, 2020-Q1 | 47ns |
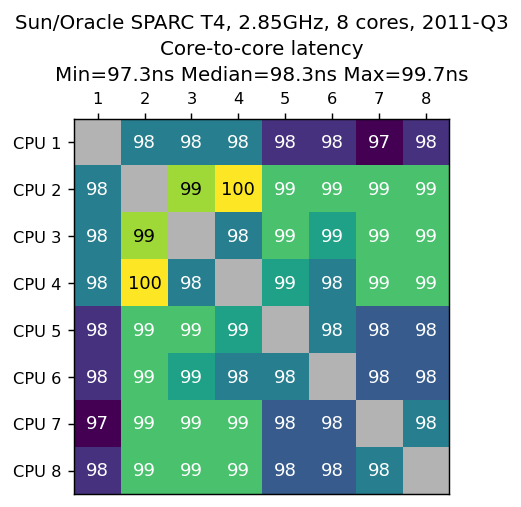
| Sun/Oracle SPARC T4, 2.85GHz, 8 cores, 2011-Q3 | 98ns |
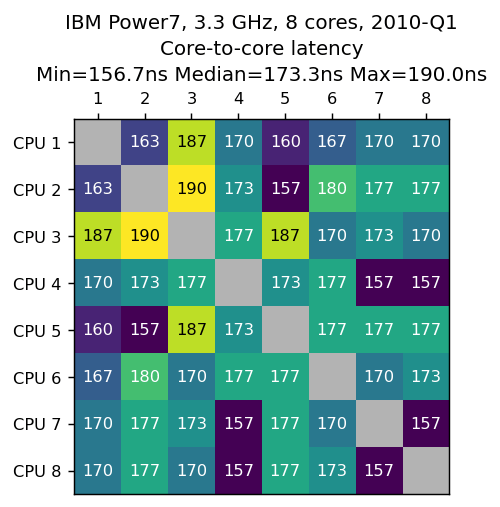
| IBM Power7, 3.3GHz, 8 Cores, 2010-Q1 | 173ns |
| IBM PowerPC 970, 1.8GHz, 2 Cores, 2003-Q2 | 576ns |
Intel Core i9-12900K, 8P+8E Cores, Alder Lake, 12th gen, 2021-Q4
Data provided by bizude.
This CPU has 8 performance cores, and 2 groups of 4 efficient cores. We see CPU=8 with fast access to all other cores.
Intel Core i9-9900K, 3.60GHz, 8 Cores, Coffee Lake, 8th gen, 2018-Q4
My gaming machine, it's twice as fast as the other server-oriented CPUs.
Intel Core i7-1165G7, 2.80GHz, 4 Cores, Tiger Lake, 11th gen, 2020-Q3
Data provided by Jonas Wunderlich.
Intel Core i7-6700K, 4.00GHz, 4 Cores, Skylake, 6th gen, 2015-Q3
Data provided by CanIGetaPR.
Intel Core i5-10310U, 4 Cores, Comet Lake, 10th gen, 2020-Q2
Data provided by Ashley Sommer.
Intel Core i5-4590, 3.30GHz, 4 Cores, Haswell, 4th gen, 2014-Q2
Data provided by Felipe Lube de Bragança.
Apple M1 Pro, 6P+2E Cores, 2021-Q4
Data provided by Aditya Sharma.
We see the two efficent cores clustered together with a latency of 53ns, then two groups of 3 performance cores, with a latency of 40ns. Cross-group communication is slow at ~145ns, which is a latency typically seen in multi-socket configurations.
Intel Xeon Platinum 8375C, 2.90GHz 32 Cores, Ice Lake, 3rd gen, 2021-Q2
From an AWS c6i.metal machine.
Intel Xeon Platinum 8275CL, 3.00GHz 24 Cores, Cascade Lake, 2nd gen, 2019-Q2
From an AWS c5.metal machine.
Intel Xeon E5-2695 v4, 2.10GHz 18 Cores, Broadwell, 5th gen, 2016-Q1
From a machine provided by GTHost
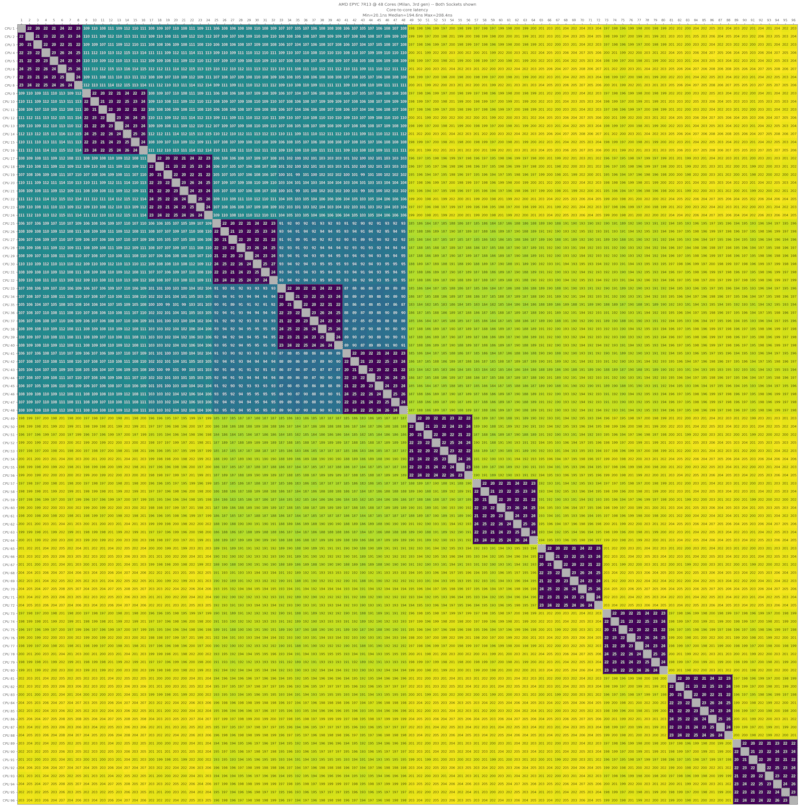
AMD EPYC 7R13, 48 Cores, Milan, 3rd gen, 2021-Q1
From an AWS c6a.metal machine.
We can see cores arranged in 6 groups of 8 in which latency is excellent within (23ns). When data crosses groups, the latency jumps to around 110ns. Note, that the last 3 groups have a better cross-group latency than the first 3 (~90ns).
AMD Ryzen Threadripper 3960X, 3.80GHz, 24 Cores, Zen 2, 3rd Gen, 2019-Q4
Data provided by Mathias Siegel.
We see the CPUs in 8 groups of 3, and better performance for CPUS in the group [13,24].
AMD Ryzen Threadripper 1950X, 3.40GHz, 16 Cores, Zen, 1st Gen, 2017-Q3
Data provided by Jakub Okoński
We see the CPUs in 4 groups of 4, and better performance for CPUS in the group [9,16].
AMD Ryzen 9 5950X, 3.40GHz 16 Cores, Zen3, 4th gen, 2020-Q1
Data provided by John Schoenick.
We can see two groups of 8 cores with latencies of 17ns intra-group, and 85ns inter-group.
AMD Ryzen 9 5900X, 3.40GHz, 12 Cores, Zen3, 4th gen, 2020-Q4
Data provided by Scott Markwell.
We see two groups of 6 cores with latencies of 16ns intra-group and 84ns inter-group.
AMD Ryzen 7 5700X, 3.40GHz, 8 Cores, Zen3, 4th gen, 2022-Q2
Data provided by Ashley Sommer.
AMD Ryzen 7 2700X, 3.70GHz, 8 Cores, Zen+, 2nd gen, 2018-Q3
Data provided by David Hoppenbrouwers.
We can see 2 groups of 4 cores with latencies of 24ns intra-group, and 92ns inter-group.
AWS Graviton3, 64 Cores, Arm Neoverse, 3rd gen, 2021-Q4
From an AWS c7g.16xlarge machine.
AWS Graviton2, 64 Cores, Arm Neoverse, 2nd gen, 2020-Q1
From an AWS c6gd.metal machine.
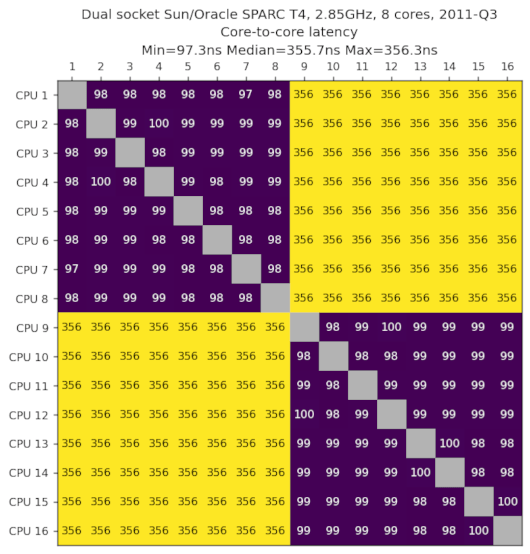
Sun/Oracle SPARC T4, 2.85GHz, 8 cores, 2011-Q3
Data provided by Kokoa van Houten.
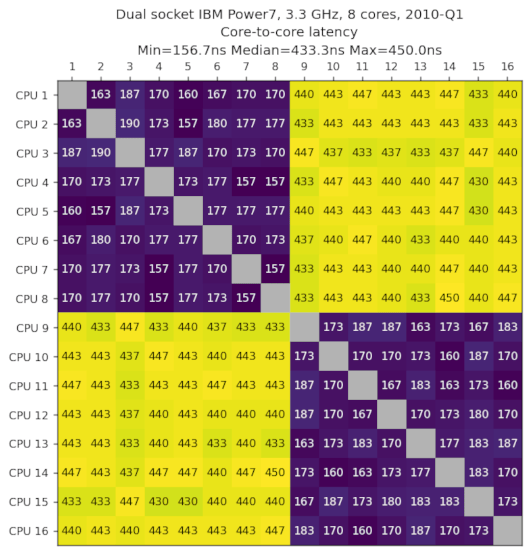
IBM Power7, 3.3GHz, 8 Cores, 2010-Q1
Data provided by Kokoa van Houten.
Dual sockets results
The following shows dual-socket configuration latency where one CPU on the first socket sends a message to another CPU on the second socket. The number in parenthesis next to the latency denotes the slowdown compared to single socket.
| CPU | Median Latency |
|---|---|
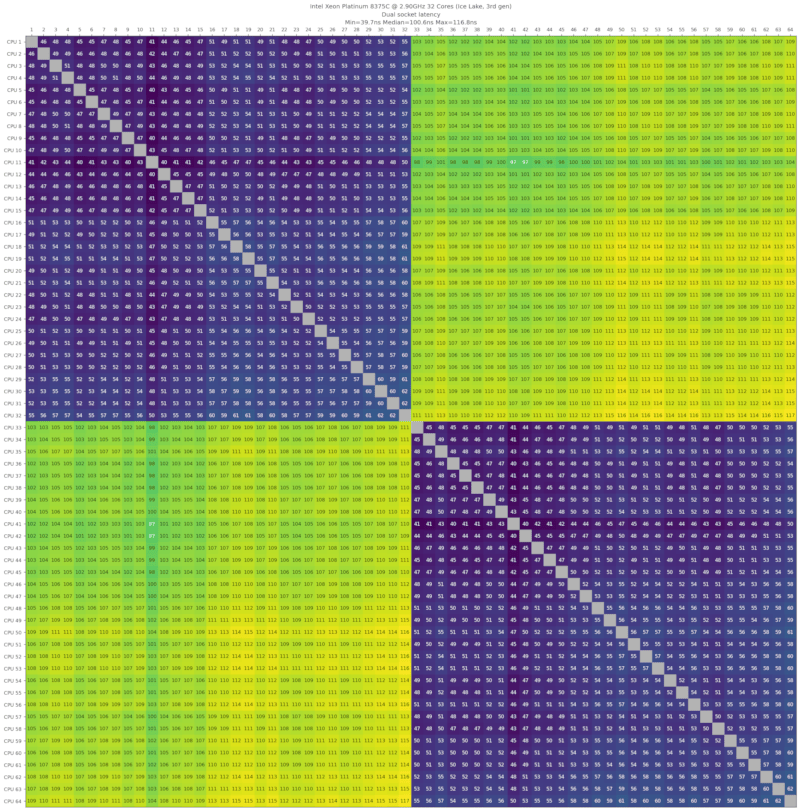
| Intel Xeon Platinum 8375C, 2.90GHz, 32 Cores, Ice Lake, 3rd gen, 2021-Q2 | 108ns (2.1x) |
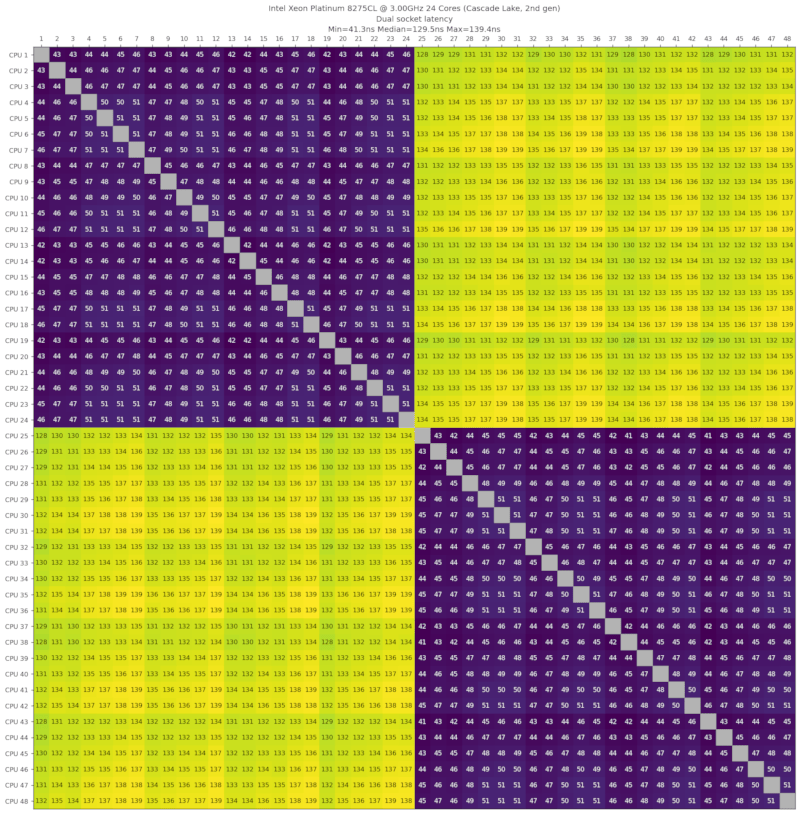
| Intel Xeon Platinum 8275CL, 3.00GHz, 24 Cores, Cascade Lake, 2nd gen, 2019-Q2 | 134ns (2.8x) |
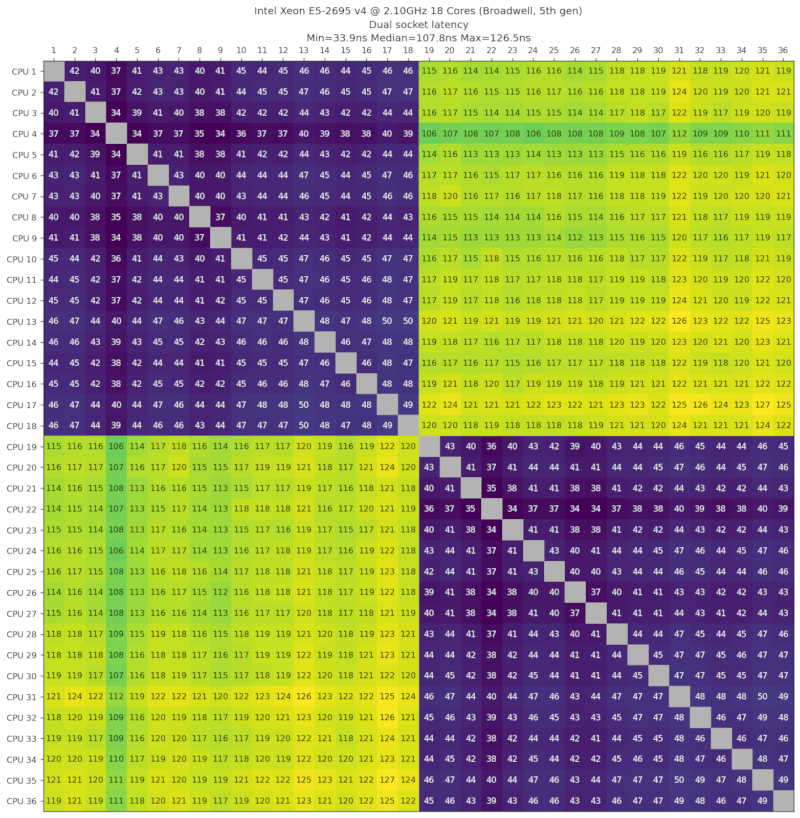
| Intel Xeon E5-2695 v4, 2.10GHz, 18 Cores, Broadwell, 5th gen, 2016-Q1 | 118ns (2.7x) |
| AMD EPYC 7R13, 48 Cores, Milan, 3rd gen, 2021-Q1 | 197ns |
| Sun/Oracle SPARC T4, 2.85GHz, 8 cores, 2011-Q3 | 356ns (3.6x) |
| IBM Power7, 3.3GHz, 8 Cores, 2010-Q1 | 443ns (2.5x) |
Dual Intel Xeon Platinum 8375C, 2.90GHz 32 Cores, Ice Lake, 3rd gen, 2021-Q2
From an AWS c6i.metal machine.
Dual Intel Xeon Platinum 8275CL, 3.00GHz 24 Cores, Cascade Lake, 2nd gen, 2019-Q2
From an AWS c5.metal machine.
Dual Intel Xeon E5-2695 v4, 2.10GHz 18 Cores, Broadwell, 5th gen, 2016-Q1
From a machine provided by GTHost
Dual AMD EPYC 7R13, 48 Cores, Milan, 3rd gen, 2021-Q1
From an AWS c6a.metal machine.
This one is a bit odd. The single socket test for Socket 1 shows median latencies of 107ns cross-groups, but Socket 2 shows 200ns. It's 2x slower, very odd. The other platforms don't behave this way. In fact, the socket-to-socket latencies are than the core-to-core within Socket 2.
Anandtech have measured similar results on a Dual-Socket AMD EPYC 7763 and 7742.
Socket 2 does not behave similarly than Socket 1, it's twice as slow.
Sun/Oracle SPARC T4, 2.85GHz, 8 cores, 2011-Q3
Data provided by Kokoa van Houten.
Dual IBM Power7, 3.3GHz, 8 Cores, 2010-Q1
Data provided by Kokoa van Houten.
Hyper-threads
We measure the latency between two hyper-threads of the same core
| CPU | Median Latency |
|---|---|
| Intel Core i9-12900K, 8+8 Cores, Alder Lake, 12th gen, 2021-Q4 | 4.3ns |
| Intel Core i9-9900K, 3.60GHz, 8 Cores, Coffee Lake, 9th gen, 2018-Q4 | 6.2ns |
| Intel Core i7-1165G7, 2.80GHz, 4 Cores, Tiger Lake, 11th gen, 2020-Q3 | 5.9ns |
| Intel Core i7-6700K, 4.00GHz, 4 Cores, Skylake, 6th gen, 2015-Q3 | 6.9ns |
| Intel Core i5-10310U, 4 Cores, Comet Lake, 10th gen, 2020-Q2 | 7.3ns |
| Intel Xeon Platinum 8375C, 2.90GHz, 32 Cores, Ice Lake, 3rd gen, 2021-Q2 | 8.1ns |
| Intel Xeon Platinum 8275CL, 3.00GHz, 24 Cores, Cascade Lake, 2nd gen, 2019-Q2 | 7.6ns |
| Intel Xeon E5-2695 v4, 2.10GHz, 18 Cores, Broadwell, 5th gen, 2016-Q1 | 7.6ns |
| AMD EPYC 7R13, 48 Cores, Milan, 3rd gen, 2021-Q1 | 9.8ns |
| AMD Ryzen Threadripper 3960X, 3.80GHz, 24 Cores, Zen 2, 3rd Gen, 2019-Q4 | 6.5ns |
| AMD Ryzen Threadripper 1950X, 3.40GHz, 16 Cores, Zen, 1st Gen, 2017-Q3 | 10ns |
| AMD Ryzen 9 5950X, 3.40GHz, 16 Cores, Zen3, 4th gen, 2020-Q4 | 7.8ns |
| AMD Ryzen 9 5900X, 3.40GHz, 12 Cores, Zen3, 4th gen, 2020-Q4 | 7.6ns |
| AMD Ryzen 7 5700X, 3.40GHz, 8 Cores, Zen3, 4th gen, 2022-Q2 | 7.8ns |
| AMD Ryzen 7 2700X, 3.70GHz, 8 Cores, Zen+, 2nd gen, 2018-Q3 | 9.7ns |
| Sun/Oracle SPARC T4, 2.85GHz, 8 cores, 2011-Q3 | 24ns |
| IBM Power7, 3.3GHz, 8 Cores, 2010-Q1 | 70ns |
The notebook results/results.ipynb contains the code to generate these graphs
How to use
First install Rust and gcc on linux, then:
$ cargo install core-to-core-latency
$ core-to-core-latency
Num cores: 10
Using RDTSC to measure time: false
Num round trips per samples: 1000
Num samples: 300
Showing latency=round-trip-time/2 in nanoseconds:

       0       1       2       3       4       5       6       7       8       9
  0
  1   52±6
  2   38±6    39±4
  3   39±5    39±6    38±6
  4   34±6    38±4    37±6    36±5
  5   38±5    38±6    38±6    38±6    37±6
  6   38±5    37±6    39±6    36±4    49±6    38±6
  7   36±6    39±5    39±6    37±6    35±6    36±6    38±6
  8   37±5    38±6    35±5    39±5    38±6    38±5    37±6    37±6
  9   48±6    39±6    36±6    39±6    38±6    36±6    41±6    38±6    39±6

Min  latency: 34.5ns ±6.1 cores: (4,0)
Max  latency: 52.1ns ±9.4 cores: (1,0)
Mean latency: 38.4ns
Contribute
Use core-to-core-latency 5000 --csv > output.csv to instruct the program to use
5000 iterations per sample to reduce the noise, and save the results.
It can be used in the jupter notebook results/results.ipynb for rendering graphs.
Create a GitHub issue with the generated output.csv file and I'll add your results.
License
This software is licensed under the MIT license
Dependencies
~5–7.5MB
~135K SLoC